
Smart Mapping
-

Get Started
Make beautiful and informative maps FAST with ArcGIS Online Map Viewer
-
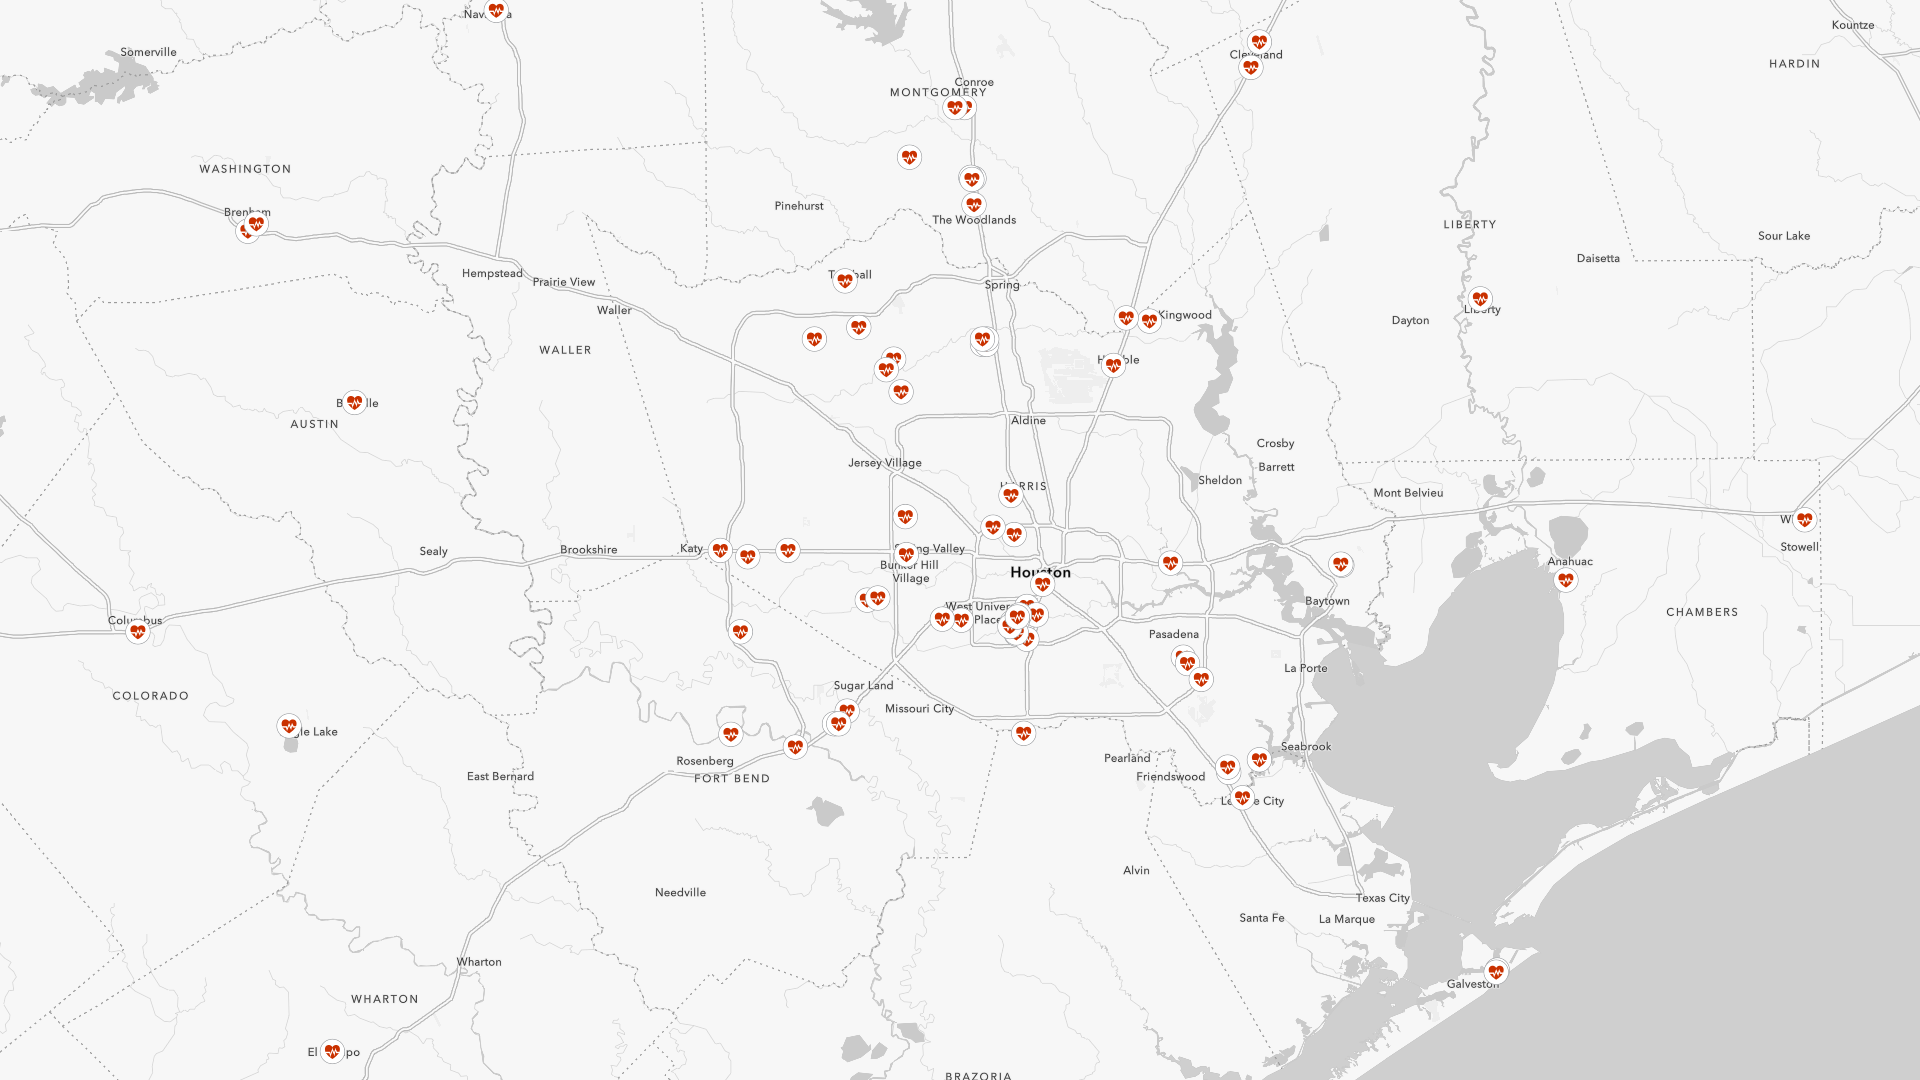
Location (single symbol)
Visualize all of your features with one symbol
-
Types (unique symbols)
Display your features by their category.
-

Counts and Amounts (size)
Use different symbol sizes to represent your numerical or ranked data.
-

Counts and Amounts (color)
Use color to reveal significant patterns in your numerical or ranked data
-

Color and Size
Vary the color and size of features based on their numerical data.
-

Compare A to B
Compare two numbers as a percent or ratio of one to the other.
-

Predominance
Quickly compare multiple attributes to determine the largest value
-

Relationship
Visualize patterns normally hidden between related numeric attributes.
-

Continuous Timeline and Age
Visualize your date/time attributes with color or size to emphasize new and old patterns.
-

Clustering
Clustering helps to visualize patterns of points without the traditional issues of overlap.
-

Dot Density
Visually display different related attributes and humanize your maps with dot density.
-

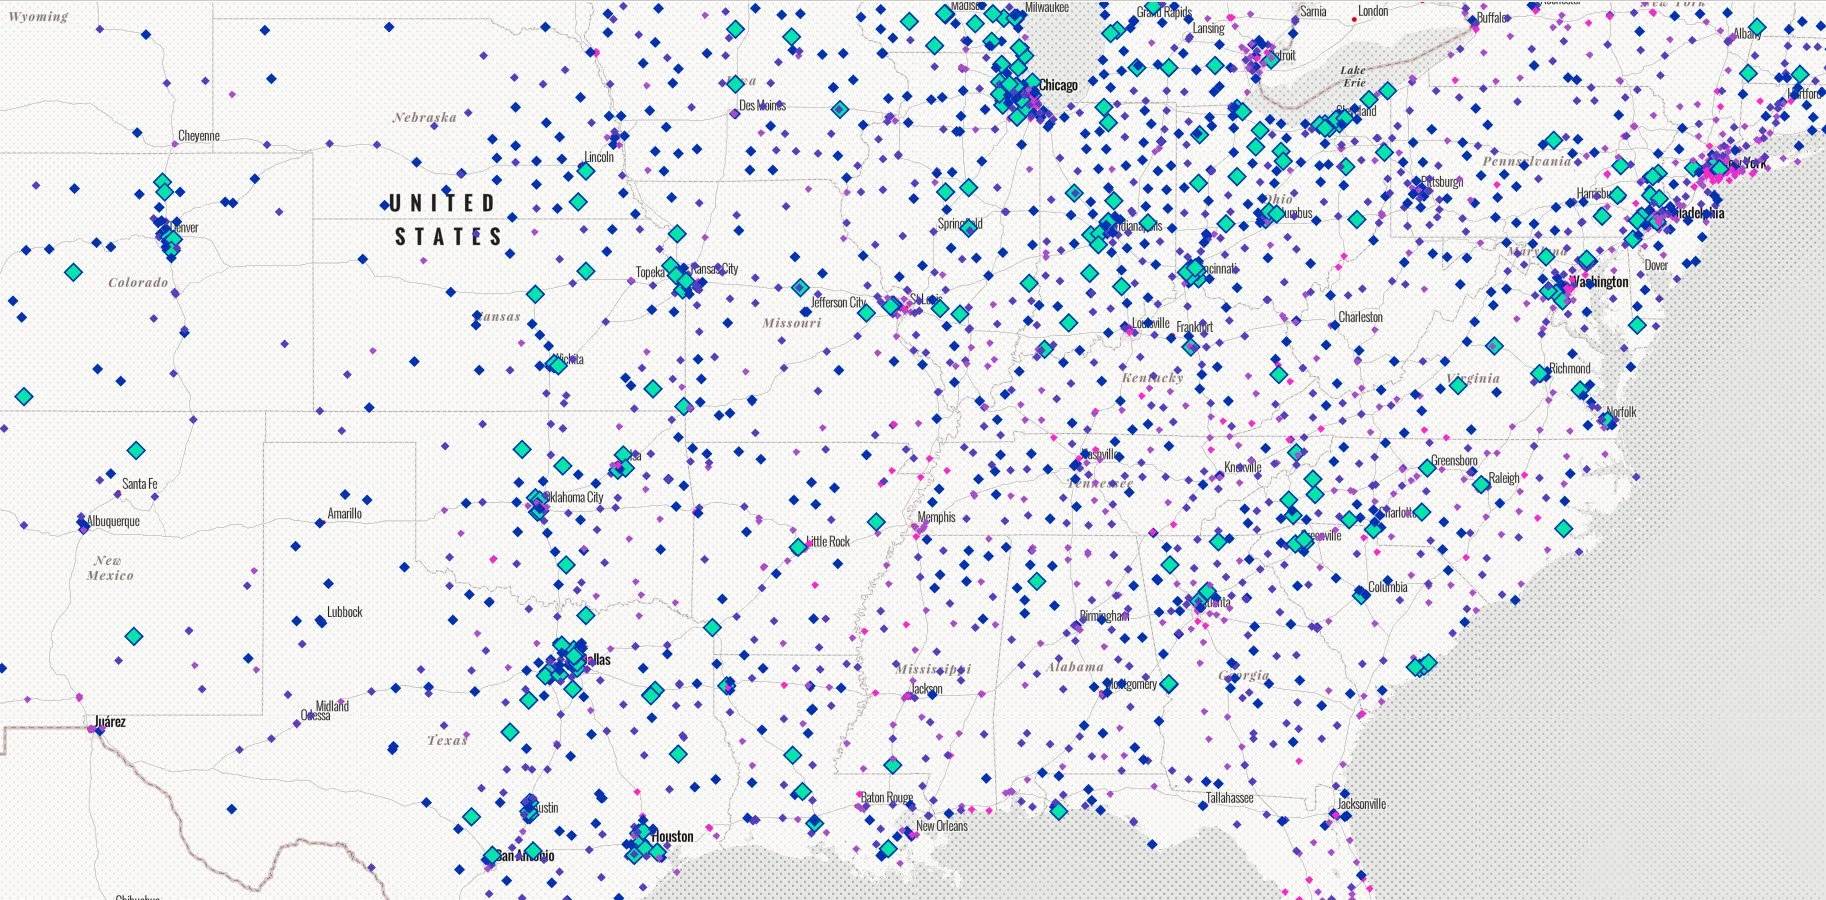
Heat Map
Use heat maps to reveal patterns within overlapping point datasets.
-

Charts
Visualize multiple numeric attributes as proportional chart symbols in your maps.